Wave: A spectrometer for hobbyists
Spectrometers are really cool tool to try out, and useful for a variety of scientific analytical techniques. Hobbyists don’t have much access to them - they can either spend a significant amount of money on one, or a significant amount of time building and tweaking one. My aim with this project was to develop a proof-of-concept budget spectrometer for educational and general scientific purposes, with better performance than currently available low-cost spectrometers.
This is the story of the IONICHEM Wave, my university final year major project from 2018. It’s a modular spectrometer designed to make science more accessible to hobbyists. I wrote this post to provide a more shareable summary of the project than my hastily-written undergraduate dissertation. It’s a high-level summary of a year of work, so there are bits glossed over, forgotten or missing. You can download a PDF of the whole report but be warned: it’s pretty rough around the edges.

The final prototype
The Wave is a small visible light spectrometer that can do either absorption or emission spectroscopy. That means can be used for water quality monitoring, measuring light source output, and many other tasks - either in the lab or in the field. To keep things flexible, it doesn’t need to be connected to a computer - you can operate it from any phone, tablet or computer with WiFi. The final sale price worked out to around £300 - more accessible than alternatives, but still higher than I was aiming for. This project was enough to get to the proof-of-concept stage. There’s a lot of simplification that could be done to make the spectrometer cheaper and better.
Who is it for?
Home scientists and students, who are interested in things like:
- Environmental science - water quality testing
- Aquariums - water quality testing and lamp emission spectra
- Chemistry - measuring indicator solutions
- Astronomy & physics - emission spectroscopy of stars, lamps and flames
Many of these people are still young students, with limited budget for hobbies. They’re mostly interested in absorption spectroscopy, with some interest in emission, fluorescence and reflectance. Most would be using it indoors rather than in the field, and would prefer a quantitative manual process with more control over something more automated or qualitative.
The brief was provided by IONICHEM, an analytical chemistry company based in East Sussex. The company identified a need for low-cost visible light spectrometers aimed at the advanced hobbyist level, with potential for classroom, field or even lab use.
How do you use it?

Spectrometer in use - note the cuvette filled with a sample.
Here’s an overview of an absorption measurement:
- Turn on the spectrometer and wait for it to start up (the light will turn blue).
- Connect your smart device to the spectrometer and go to its web page.
- Fill a cuvette with a sample.
- Insert the cuvette into the sample well in the spectrometer.
- The spectrometer shines a light through the sample and measures the intensity of each wavelength that has passed through.
- View the spectrum of the sample on the webapp.
- Adjust settings as necessary and save the spectrum for analysis.
The process gets more complex when you bring in blanks and standards for calculating absorbance and concentration, but that’s the basic process of using the spectrometer.
Optical spectroscopy
Optical spectroscopy is the basis of many modern scientific analysis methods. Visible light spectroscopy is used for various analyses in labs, particularly for measuring the concentration of known components of a sample. For example, you might want to measure the free chlorine content of your tap water. It’s a key part of today’s laboratories, but high costs provide a barrier to entry to hobbyists.

Diagram of an optical spectrometer - missing details like lenses for focusing.
A beam of light enters the body of the spectrometer through a narrow slit, to make it into a 1-dimensional line. It’s typically collimated with a lens so that all the light rays are parallel. Next most spectrometers use a diffraction grating to split the light, in much the same way as a prism (think of the Dark Side of the Moon cover). Diffraction gratings are smaller than prisms and spread out the light more, making it easier to tell wavelengths apart. Next the light is often focused or bounced using lenses and curved or flat mirrors. Finally it hits a photodetector array, which has different detector sites spread across the different wavelengths. The photodetector array (or “sensor”) measures the intensity of the light that hits each part of it, so it measures the intensity of each wavelength of light.
Spectroscopy techniques
That’s roughly how a spectrometer works, now let’s cover what it can be used for:
- Emission spectroscopy: Measuring the spectrum emitted by a light source. Just point it at the light (often via a fibre optic cable)!
- Absorption spectroscopy: Measuring the spectrum absorbed by a sample, by shining a light through it. By comparing the light absorbed by the sample compared to the light absorbed by a set of standards, you can determine the concentration of the sample.
- Reflectance: Measuring the spectrum of a light bounced off a sample.
- Fluorescence: Measuring the light emitted by a sample when it’s excited by a light source. Often you shine a light through it, and measure the light output at 90 degrees to that.
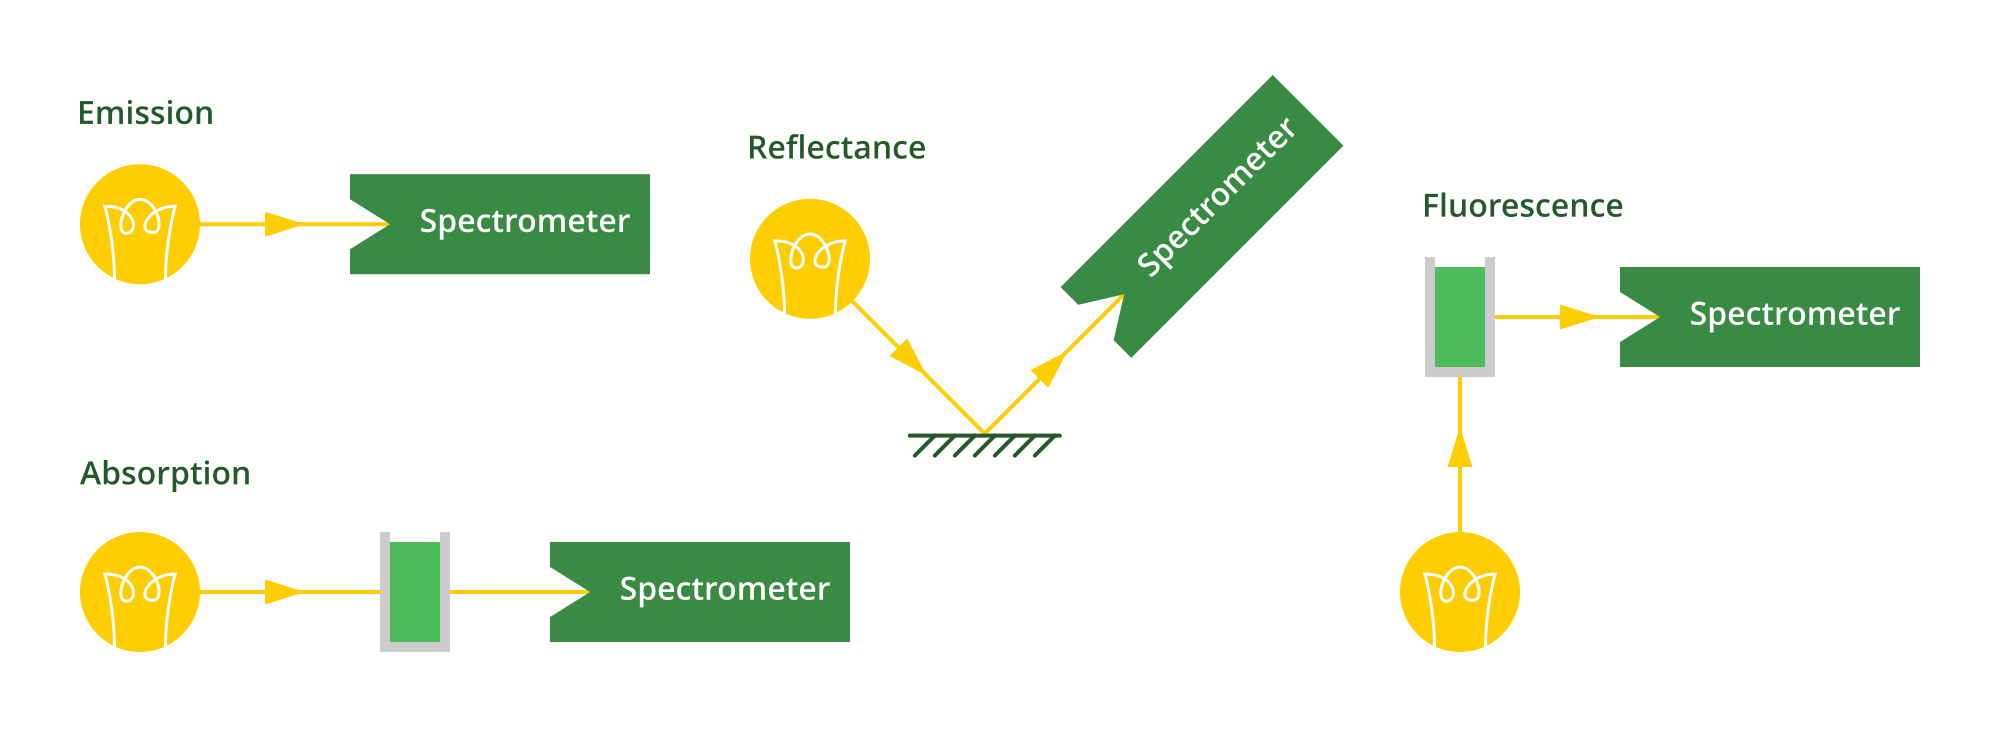
Different spectroscopy methods
Light sources
Absorption, reflectance and fluorescence spectroscopy need a known light source, which turns out to be a difficult problem! The obvious first choice is a white LED - lots of light output with not much heat output. Unfortunately they have a big drop in intensity in the cyan range, so you get inconsistent signal-to-noise ratio across the spectrum. Fluorescent lights aren’t any better - they have lots of spikes at different wavelengths. That makes it less useful for trying to measure the in-between wavelengths, as there’s not much light there to start with, even before absorbing some of it.

Light output of incandescent vs LED vs fluorescent lamps
Incandescent lights have a much more even output across different wavelengths. They’re lacking in blue light, but make up for it in the infrared, which can also be interesting. The challenge of using an incandescent light will be managing its heat output.
User research
Now I knew a little about spectroscopy I was equipped to talk to users. This is a fairly typical student project, so the user research is pretty basic. I started with a survey of some relevant reddit communities, and followed that up with two interviews with expert spectrometer users.
I posted the survey on subreddits for chemistry, physics, astronomy, environmental science and aquariums. The demographic results I got were roughly what you would expect for scientific communities on reddit at the time - most were aged 18-35, had a bachelor’s degree and were still in education. Most don’t own a spectrometer but some can access one at university or at work. They’d like to have manual control of the spectrometer, but with a degree of automation for ease of use. They’re largely interested in absorption spectroscopy for curiosity and experimentation.
So I chose to focus on a low price range and absorption spectroscopy. Users who are looking at higher price ranges are more likely to be able to afford the existing options.
Interviewing expert users
The two expert users I interviewed would be considered “extreme” users. Their usage and requirements are far beyond what my product will support, but they bring up some interesting pain points and opportunities.
The first expert user was Dr Terry Ireland, a Brunel research fellow in phosphors and nanomaterials. He demonstrated his usage of a specialised phosphor spectrometer, and I identified two pain points:
- Using the spectrometer required a specialised program which had analysis capabilities, but they didn’t cover what he needed it to do. Instead he exported the data to Excel.
- Better analysis capabilities would be nice, but I’m unlikely to know everything a user might want to do with the data. It’s important that my spectrometer can export data to be analysed in a program that the user is comfortable with.
- Lights had to be turned off in the room for accurate measurement, as the spectrometer was extremely sensitive and not adequately sealed.
- It’s critical that stray light from outside is eliminated, to avoid affecting the measurement.
My second interviewee was Dr Rakesh Kanda, a Brunel professor in environmental science. He confirmed it’d be useful for environmental scientists if the spectrometer was portable. Much of their work is field work, particularly since some tests are only viable for a short time after the sample is taken. For many modern analyses, a UV-sensitive spectrometer is required, but he mentioned that visible light spectroscopy still has a place in teaching. Price is a major factor for his students with their limited research budget.
Personas
Based on my user research, I created 5 user personas representing the different types of users. These are profiles of imaginary users, representing both typical and extreme users of the product. Here they are:

The five user personas, based on my survey and interviews.
I referred back to these personas when making later decisions about how people would use the spectrometer. However I definitely could have kept them in mind more, and developed them a bit further.
Prototyping spectrometers
Early tests
Up until this point I hadn’t actually tried making a spectrometer! Pretty rapidly I iterated through a few different prototypes to investigate how it works:
- Pointing a phone camera at a diffraction grating made from a DVD. The curved DVD made the spectrum curved too, and nothing was rigidly mounted.
- Mounting a slit and diffraction grating on foamboard stands, and using a phone camera. Allowed me to adjust distances and angles nicely, but couldn’t easily be pointed at anything.
- Installing a Raspberry Pi Zero and ZeroCam NoIR inside a cardboard box (to exclude light) with a slit on the front. It worked but was hard to adjust.
- A smaller cardboard spectrometer. Its resolution was extremely low (I later worked out this was because the optical path was too short for the size of the slit).
- A laser-cut optical bench, with scales for distances and angles and mounts for the slit, the grating and the camera. This worked really well for experimentally determining angles and distances that worked best.

A few of the early prototypes, with the "optical bench" in the centre, and the later laser cut "box spectrometers" on the right

Comparing my optical bench prototype with a commercially available spectrometer - the Ocean Optics USB2000+, using a fluorescent lamp. It's not bad! The USB2000+ has less noise and is more sensitive at lower light levels, but that's to be expected from a much more expensive unit.
Box spectrometers
Following the success of the optical bench prototype I created more laser-cut prototypes. These had less flexibility in dimensions, having already figured out roughly what worked. The interlocking MDF design made them very rigid and reasonably light-proof. “Box spectrometer” prototype 1 had too short an optical path, meaning the slit was too large in the image and the resolution was low. Importantly, however, it enabled me to take my first absorption measurement! IONICHEM provided me with some standards - diluted ink samples of known concentrations. By shining a light through a cuvette of each standard, I could get a spectrum for each, along with a “blank” of distilled water. At each wavelength, the absorbance can be calculated for each standard, giving the graph below:

Absorbance spectra of the various standards, compared to a blank sample of water. The negative absorbance values are odd and possibly due to scattering of the light. However, between 490 and 570nm the values would be useful for finding the concentration of an unknown sample.
The second box spectrometer prototype lengthened the optical path, making the slit much smaller in the image. This meant it could resolve much more detail in the spectrum. I also added a 3D-printed TOSLINK connector on the input end, making it easy to use cheap, off-the-shelf TOSLINK audio cables.
Final optical design
Using an incandescent lamp for the light source brings some challenges. Firstly, there aren’t many available. The most appropriate one I found was a small W5W halogen bulb used for small lights in vehicles. But the sockets for them aren’t very rigidly mounted and allow the bulb to wiggle around. They also get quite warm, meaning the surrounding the material needs to be able to withstand the heat.
Another challenge is focusing the light from the bulb into the fibre optic. First I tried using a reflector to focus light from the bulb into the fibre. It didn’t work. Next I used a small lens between the lamp and the fibre, again to focus the light. A small lens increased the amount of light entering the fibre optic by 37%. Polishing the ends of the fibre also helped. In the final spectrometer these parts are mounted to a base which allows them to slide for adjustment.
Reflections inside the optical box of the spectrometer were also a problem. Stray light reflects around the spectrometer and makes the sensor detect light at wavelengths where there shouldn’t be any. I added baffles inside the box to catch the stray light.

The final optical design:
1. Halogen bulb generates visible light of all wavelengths, plus some infrared.
2. Lens (inefficiently) focuses light into fibre optic.
3. Fibre optic directs light into sample cuvette.
4. Light passes through sample cuvette and some is absorbed by the sample.
5. Light passes through second fibre optic in the module connector, into the spectrometer module.
6. Light passes through slit, making it a thin line.
7. Stray light to the sides is caught by baffles inside the body of the spectrometer.
8. Light is split into its different wavelengths by a diffraction grating.
9. Light is focused by a lens onto the camera sensor. Different wavelengths come in from different angles, so are focused onto different areas of the sensor.

These are the actual internals of the final prototype. The MDF box houses the slit, diffraction grating and camera. The cuvette holder is the hole on the right side. Further to the right is the lens and the lamp. On the front of the MDF optical box is the Raspberry Pi, plus a custom PCB with a PIC microcontroller controlling power to the Pi as well as the lamp, power button and indicator LED.
Developing the concept
Ideation
I needed to define the product concept better than just “a cheap spectrometer”. Ideas so far had ranged from a portable handheld spectrometer for use in the field, to a spectrometer kit for “makers”. I drew a lot of ideation sketches and had a few discussions with Martin from IONICHEM to refine the concept.
It’s clear that users come from a variety of backgrounds and have a variety of needs. A modular design seemed like a good idea, allowing users to select modules that fit their needs. A spectrometer kit might appeal to some users, but many would prefer to concentrate on their investigations rather than making the spectrometer itself the project.


These are various sketches from a bit later than the initial ideation - at this point I'm not sure where the originals went!
Modularity
I’d already decided to make the spectrometer modular to support both absorption and emission spectroscopy. But there was still the question of the degree of modularity. For emission spectroscopy, you need the spectrometer module and a fibre optic cable. Absorption spectroscopy is a little more complicated - you could have a separate sample holder module and lamp module, or merge them. The advantage of a changeable lamp module would be that you can use different light sources for different tests. However for the sake of simplicity I chose to combine the lamp and sample holder into one module.


The modules need to be able to connect optically (for the light to pass through) and electrically (to power the lamp, and possibly communicate or identify which module is connected). The obvious choice for the optical connector was TOSLINK, as there are fibre optic cables readily available with this connector for use in optical audio systems. The large 1mm acrylic fibre optic inside means they transmit plenty of light and are easy to focus into. I added two spring-loaded contacts to the face of the connector between the two modules to connect 12V and ground pins to the lamp. In an actual product, this would be extended for future proofing, with an extra 5V or 3.3V pin for powering a microcontroller as well as i2c pins for communication.
User interface
The real unique selling point of this spectrometer would be its user interface. I wanted something that would allow you to be free of a desktop computer (while allowing power users to still do their analysis on one). With the variety in home users’ operating systems and devices, it would be nice to have something operating system independent. A built in interface increases the cost of each spectrometer, but offers a consistent and always-available experience. Alternatively the spectrometer could connect to another device with a screen - a smart device like a computer, tablet or phone.
I’ve seen a lot of app-connected products whose apps stopped working and became useless. I wanted to avoid that. Instead, this spectrometer hosts a website on its own WiFi network. Any smart device can connect to that network and visit the website in a browser. This avoids the need for future updates and means the interface will always work (with the exception of security certificates for the network and the website).
To support this web interface, I used the Python module Flask.
The socketio module allows the Javascript code running on the smart device to communicate back and forth with the spectrometer.
Later in the project, I conducted an interview with Martin from IONICHEM to go through the typical steps to take an absorption measurement. After recording those steps, I could start designing a user interface to help you through them. I created a wireframe of the screens needed to do those steps and converted it to a PDF with clickable links - that let Martin try it out and provide feedback. This UI stayed as a wireframe - the actual prototype of the spectrometer only has a spectrum view with the ability to adjust settings.

A section of the UI wireframe, showing the home page and part of the workflow. The idea was that you'd be able to create "saved tests", which would be a preset of what wavelength to test at, how much averaging, and other settings.
Final prototype
After some more ideation, I designed the spectrometer exterior to match the name: IONICHEM Wave. It has a calm blue-and-white theme, and a wave motif on each end. I modelled the insides of the spectrometer in Rhino along with a rough version of the exterior design, then re-modelled the exterior in Creo. Honestly I can’t remember why I did that and couldn’t just use the model straight from Rhino.
The case of the spectrometer was routed from high density polyurethane foam (Ureol). I mounted the laser-cut spectrometer box inside and added a 3D-printed interface between the two halves of the spectrometer. The lamp, lens and cuvette holder are mounted to a piece of plastic inside the absorption module.

One of the glamour shots of the final prototype. I'm really pleased with the finish I got on this, considering that this is the working prototype!
Conclusion
IONICHEM feedback
I created an absorbance spectrum of another set of blue ink samples of known concentrations. The resulting calibration curve wasn’t as perfectly linear as IONICHEM’s WPA spectrometer, but it’s linear enough to be useful for analysis. Demonstrating this to Martin from IONICHEM, he was very pleased that the prototype is a great proof of concept, and that it’s able to produce useful results. He noted that it would be great to see the planned UI implemented as that could be a major differentiating feature for the product.
My conclusions
In terms of the technical specs, it’s hit and miss. The spectrometer meets my target 400-700nm spectral range, and exceeds the specified 1nm pixel resolution. However the sample rate and latency are worse than I was aiming for, because it’s badly optimised image processing code running in Python on a Pi Zero. I’m sure with a good developer it could be improved a lot!
At an estimated £300 final sales price, it’s within the target £200-400 price range but more expensive than I was hoping for it to be. That risks keeping it out of reach of some users who can’t justify that kind of expense just because they’re interested in trying spectroscopy. I think there’s a lot of room to scale the concept down, and do just as much science with less processing power and sensor cost.
Overall, though, I would call the project a success! In just a year I developed a spectrometer that actually works and would get useful scientific results! There’s a lot of optimisation to do and a load of UI work, but I’m very happy to call this a good proof of concept.
Future development possibilities
There are three areas I’d focus on when taking this further:
- Implementing and improving the UI
- Being able to take and analyse absorption measurements on the device would be hugely useful
- Reducing complexity and cost
- Simpler sensor would mean less processing power required (no need for a powerful Raspberry Pi)
- UI on unit instead of complex webapp (I learned my lesson here!)
- New modules
- Alternative light sources, including of known wavelengths for rough calibration
- Different spectroscopy attachments - reflectance and fluorescence